Chris Coghlan MP and Professor Paolo Surico
Table of Contents
1. Introduction: The UK Productivity Crisis
2. Why R&D — and Defence R&D Specifically — Can Solve It
3. The UK’s R&D and Defence-Tech Scale-Up Finance Gap
4. Financing the Solution: Fiscal Options
5. Chris Coghlan MP’s Perspective: A Voice from Parliament
Executive Summary
· Britain’s central economic problem is no longer a normal cyclical slowdown but a long productivity stagnation: the House of Commons Library notes that UK labour productivity historically grew by about 2% a year, but has risen much more slowly since the 2008-09 recession, and that UK GDP per hour in 2023 was around 20% below the United States (House of Commons Library).
· The UK’s national security problem and its productivity problem now point to the same answer: a long-term programme of public research and development, with defence R&D as the anchor mission. The 2025 Strategic Defence Review accepted all 62 recommendations and committed the UK to a “NATO first” posture, while the Government’s defence trajectory has moved from the old 2% floor towards 2.5% by 2027 and an ambition of 3% in the next Parliament (Strategic Defence Review 2025).
· The economic evidence is unusually clear: Antolin-Diaz and Surico find that military spending has large and persistent output effects because it shifts public spending towards R&D, and that public R&D is the spending component with persistent effects on output, total factor productivity, innovation and private investment over long horizons (Antolin-Diaz and Surico, ADS-LREGS-Mar24.pdf).
· Recent NBER-CBO modelling estimates that an additional federal R&D dollar can raise present-value GDP by several dollars over thirty years, with effects on productivity lasting roughly three decades; the paper’s combined estimates are around 3.57 dollars of present-value GDP per deficit-financed federal R&D dollar and 3.82 dollars per deficit-neutral federal R&D dollar over 2027-2056 (Campbell et al., w35472.pdf; NBER working paper 35472).
· A newer patent-level study, tracking every US patent’s funding source and ownership since 1950, provides a third independent cross-check and a design lesson: publicly funded but privately owned patents are only about 2% of filings, yet explain roughly one-fifth of medium-run swings in GDP and productivity, with a model-implied present-value output multiplier of 8.67 for public R&D against 4.01 for private R&D — but only when the resulting IP is privately owned, since historically DoD- and NASA-retained patents delivered smaller, often statistically insignificant effects than NIH- and NSF-funded patents that were privately owned (Gazzani, Martinez, Natoli and Surico, Where Do Technology Shocks Come From? Public Funding and Private Ownership, 2026). This is why the defence R&D mission proposed below should default to private ownership of the IP it funds, mirroring the 1980 US Bayh-Dole Act.
· This paper takes the OBR’s own November 2025 upside AI scenario — potential productivity growth reaching 1.5%, half a point above its 1.0% central case — as the working baseline for its base case, Scenario 1 (OBR Briefing Paper No.9). On that AI-inclusive baseline, closing the residual 0.5 percentage-point gap to Britain’s historic 2% productivity norm requires an additional public R&D effort of a primary central estimate of about £17 billion a year (0.57% of GDP), phased in over a decade. This is not a point forecast; it is an illustrative conversion of the NBER-CBO present-value multipliers and Antolin-Diaz-Surico impulse responses into UK spending arithmetic, using current-price GDP of about £3.0 trillion from the ONS (OBR productivity briefing; ONS GDP series YBHA; Campbell et al., w35472.pdf; Antolin-Diaz and Surico, ADS-LREGS-Mar24.pdf). Scenario 1 is worked through in full — methodology, financing and debt/GDP impact — before a second reform is layered on top.
· The financing conclusion follows the same primary framing: the £17 billion a year mature requirement equals about 6.7% of the DMO’s planned £252.1 billion of gross gilt sales in 2026-27, and a ten-year ramp adds only about £1.7 billion a year, or 0.7% of that remit, in each step (DMO Financing Remit Announcement 2026-27). The plan should therefore be OBR-certified, ring-fenced, investment-classified, phased through normal DMO issuance, and partly pooled with allies, so that it avoids the fiscal-credibility failure mode of September 2022.
· Modelling the fiscal path of the £17 billion primary programme against the OBR’s own November 2025 debt forecast shows public sector net debt rising only modestly for four years (a peak of around +0.22 percentage points of GDP above the OBR baseline in 2029-30), before the productivity dividend turns the programme debt-reducing: by 2035-36 debt-to-GDP is projected at 94.0%, roughly 2.1 percentage points below the OBR’s no-action baseline of 96.1%. Mario Draghi’s September 2025 “One Year After the Draghi Report” speech makes the identical point for Europe, noting that a modest 2% rise in total factor productivity over a decade could cut the public finance burden by a third (Draghi, High Level Conference – One Year After the Draghi Report, 16 September 2025).
· Scenario 2 layers one further, self-financing reform on top of Scenario 1: making patent purchases tax-deductible. Full expensing of intellectual property investment delivers a permanent 0.24-0.32% GDP-level gain within four to five years — a genuine, if partial, contribution to the same productivity target the R&D-bond programme exists to close. Crediting that contribution reduces the residual uplift the R&D-bond programme itself must deliver, cutting the mature borrowing requirement from Scenario 1’s £17 billion to about £16 billion a year under Scenario 2 (Request 4 below) — while the two reforms are complementary rather than substitutes: IP expensing supplies an early, front-loaded productivity kick in years 1-5 that fades as the R&D-bond programme’s slower-building but permanent uplift takes over, together tracing a path back to the UK’s historic 2% productivity norm by 2035-36 (see the productivity trajectory chart in Section 4d).
· The evidence on the Patent Box cuts against continuing to fund it at its current scale: Gaessler, Hall and Harhoff’s peer-reviewed study finds patent boxes reduce patent transfers out of a country by around 30%, but have no positive — and quite possibly a negative — effect on genuine invention activity, because they function mainly as an income-shifting device rather than a real R&D incentive (Gaessler, Hall and Harhoff, GaesslerHallHarhoff20_patent_box_RP.pdf; DOI: 10.1016/j.respol.2020.104129). This paper recommends abolishing the Patent Box and reallocating its roughly £1.3-2.0 billion annual cost.
· That reallocation is close to self-financing: redirecting the Patent Box saving to fund full expensing of intellectual property investment (estimated cost about £900 million a year) delivers roughly twice the near-term GDP payoff per pound of an equivalent addition to the public R&D programme, while leaving a net fiscal saving of £0.4-1.1 billion a year (central £1.1bn). That net saving is coincidentally close to the roughly £1 billion a year reduction in R&D-bond borrowing the same reform makes possible (above) — so IP expensing effectively pays for the smaller, reduced R&D-bond programme twice over: once through the direct fiscal saving, and once through the reduced borrowing need created by its own productivity contribution (Martinez and Surico, Full_IP_Expensing_Memo.pdf; Coghlan, ExchequerSecretaryLetter11thMarch.pdf).
· The same defence R&D mission also has a direct bearing on the UK’s NATO commitments: because it counts as defence and dual-use spending, the Scenario 1 £17 billion programme would add about 0.57 percentage points of GDP to defence-related spending at maturity, taking the UK from its current stated trajectory of around 3.0% of GDP in the early 2030s to about 3.56% of GDP by 2035-36 — just above NATO’s 3.5% core target and closing about 28% of the remaining gap to the full 5.0% Hague commitment, without requiring any additional headline defence budget beyond the R&D mission itself (NATO).
· Draghi’s speech also strengthens the case for pooled allied financing: he explicitly calls for “common debt for common projects” — joint issuance to fund breakthrough innovation and defence R&D where fragmented national spending can no longer deliver — echoing this paper’s Joint Defence R&D Bond Facility, and citing the same Antolin-Diaz and Surico research used throughout this paper (Draghi, One Year After the Draghi Report, 16 September 2025; Antolin-Diaz and Surico, ADS-LREGS-Mar24.pdf).
· The UK has strong science, universities, aerospace, cyber, AI, life sciences and advanced manufacturing capabilities, but it repeatedly fails to scale high-potential firms into large domestic companies; Surico’s scale-up finance paper argues that the gap is not invention but the transition from invention to scale, especially around Series B/C, growth and pre-IPO capital (Surico, UK_ScaleUP_Finance_Surico.pdf).
· The policy should therefore combine three instruments: a ten-year defence and dual-use R&D mission; a UK scale-up finance architecture built around the British Business Bank, British Patient Capital, patient pension capital and co-investment; and a ring-fenced borrowing instrument for productive R&D investment, including an allied Joint Defence R&D Bond Facility.
· Domestic borrowing can be justified where proceeds are contractually restricted to high-additionality R&D, defence innovation and scale-up finance, because the relevant test is whether debt increases future productive capacity rather than merely paying today’s bills (Surico, Surico_Defence_bonds.docx; Surico, Surico_BorrowingForDefence_oped080626.docx).
· Surico’s additional HM Treasury note sharpens this test: Innovation Bonds do not create fiscal space, but create commitment by hard-wiring borrowing into high-return capital formation, including NSSIF equity injections, pension-capital crowd-in and ARIA-linked defence innovation (Surico, NBorrowingForDefence_HMT.pdf).
· Joint defence bonds with allies should pool eligible defence R&D and procurement-related investment across willing partners, backed by proportional guarantees, common project governance and strict use-of-proceeds rules. The EU’s SURE programme shows that pooled borrowing can be supported by member-state guarantees, while SAFE now provides up to €150 billion of EU borrowing-backed long-maturity defence loans benefiting from the EU’s strong credit rating (European Commission SURE; European Commission SAFE).
· Chris Coghlan’s parliamentary interventions have consistently framed productivity, defence and public R&D as a single agenda: he told the House that “using defence spending focused on public R&D is one way to not only keep us safe, but raise productivity and boost economic growth,” and later argued that the economy “will only escape its difficult place if we raise economic productivity” through public R&D that crowds in high-tech start-ups and venture capital (Hansard, Spring Statement, 26 March 2025; Hansard, Spending Review 2025, 11 June 2025).
· What is at stake is not an abstract statistic. A return to Britain’s historic 2% productivity norm would mean materially faster real wage growth and a narrower share of the 20% GDP-per-hour gap with the United States; higher tax revenue at unchanged rates rather than further rises; public services funded from growth rather than from cuts or borrowing; and a larger economy that can meet NATO’s 2035 commitments without trading off against the NHS, schools or pensions (Section 1a below sets this out in full).
1. Introduction: The UK Productivity Crisis
The UK’s productivity problem is the root of its fiscal, living standards and public-service squeeze. Labour productivity is the amount of output produced per hour or per worker, and over time it is the fundamental driver of real wages, tax capacity and the affordability of public services. The House of Commons Library states that UK labour productivity historically grew by around 2% a year, but has grown much more slowly since the 2008-09 recession (House of Commons Library). The same briefing reports that UK GDP per hour in 2023 ranked fourth in the G7 and was around 20% below the United States, placing Britain behind the frontier it needs to reach if living standards are to recover decisively (House of Commons Library).
Recent official data underline the same story. The Office for National Statistics’ flash estimate for January to March 2026 reported that output per hour was only 3.5% above its pre-coronavirus 2019 average, despite gross value added being 6.8% higher and hours worked 3.2% higher (ONS). The OBR’s 2025 productivity briefing states that weak data after the financial crisis, the pandemic and the energy shock led it to revise medium-term trend output-per-hour growth down from 1.3% to 1.0% in its November 2025 forecast (Office for Budget Responsibility). A country cannot sustainably finance European-level public services, American-level innovation, NATO-level security and a falling debt ratio with productivity growth stuck near 1%.
Chris Coghlan has put the same diagnosis in parliamentary language. In the Finance Bill debate, he argued that “since the 2008 financial crash, the UK economy has been hampered by productivity growth collapsing to 0.6% per year—the second worst in the G7” and warned that without solving productivity the UK would remain in a “downward economic spiral of higher taxes, an ageing population, ever crumbling public services and ever higher debt” (Hansard, Finance Bill, 27 November 2024). This is not a call for indiscriminate austerity or indiscriminate borrowing. It is a call to distinguish between public spending that merely sustains the present and public investment that changes the economy’s future production frontier.
The UK now faces a second, overlapping structural challenge: the return of high-intensity security competition. NATO allies agreed at the 2025 Hague Summit to invest 5% of GDP annually in defence and security-related spending by 2035, split between 3.5% for core defence requirements and 1.5% for broader security, resilience, infrastructure, innovation and defence industrial-base investment (NATO). The UK Strategic Defence Review says defence spending had fallen from 4.1% of GDP in 1989 to 2.3% today, and that the Government accepted all 62 of the review’s recommendations as part of a “NATO first” strategy (Strategic Defence Review 2025). The Defence Investment Plan funding explainer subsequently confirmed £298 billion of defence investment over four years, including an additional £15 billion for 2026-27 to 2029-30, while identifying a mix of departmental reallocations, asset sales, efficiency savings and future Budget decisions to fund the uplift (UK Government Defence Investment Plan explainer).
This paper argues that the answer is not to treat defence and growth as competing claims on a fixed pot. Properly designed, defence R&D can expand the pot. The UK should finance a defence and dual-use R&D mission not as emergency consumption but as productive national investment: targeted, governed, audited and designed to crowd in private capital.
1a. The Stakes: What a Return to 2% Productivity Growth Would Mean for Britain
Before setting out the methodology and financing, it is worth being explicit about why closing this gap matters, because the figures that follow are not an abstract fiscal exercise. A sustained return from the OBR’s roughly 1% productivity trend towards Britain’s historic 2% norm would show up in four concrete places in people’s lives.
Living standards. Labour productivity is the fundamental determinant of real wages: over any reasonable time horizon, workers cannot be paid more, in real terms, than the value they create per hour. The House of Commons Library’s own framing is that the post-2008 productivity slowdown is the direct cause of the UK’s weak real-wage growth, and that UK GDP per hour in 2023 was around 20% below the United States (House of Commons Library). Compounded over a decade, the difference between 1% and 2% annual productivity growth is not marginal: it is roughly the difference between real wages standing still and real wages rising by a fifth, and it is the single largest lever available for narrowing the gap to the US frontier described above.
Public services. Chris Coghlan put the mechanism in the starkest parliamentary terms available: without solving productivity, the UK faces a “downward economic spiral of higher taxes, an ageing population, ever crumbling public services and ever higher debt” (Hansard, Finance Bill, 27 November 2024). Faster growth is what allows the NHS, schools and local government to be funded from an expanding tax base rather than from real-terms cuts or ever-rising borrowing; the debt-to-GDP modelling in Section 4c below shows this mechanically, with the productivity dividend from R&D investment turning a modest near-term borrowing increase into a debt-reducing programme by the 2030s.
Lower tax, not higher tax. Because UK tax revenue moves roughly in line with GDP — this paper’s own modelling in Section 4c uses a standard 40% marginal receipts-to-GDP ratio consistent with OBR forecasts — permanently faster growth raises the tax take at unchanged rates, rather than requiring the rate rises that fund a stagnant economy’s fixed public-spending commitments. Mario Draghi has made the equivalent point for the whole of Europe: a modest 2% rise in total factor productivity over a decade could cut the public finance burden by a third, because projects that raise output faster than their interest cost gradually restore fiscal space rather than consuming it (Draghi, One Year After the Draghi Report, 16 September 2025).
National security. A more productive economy is also a more secure one, in two distinct ways. First, a larger economy can sustain a given share of GDP on defence more easily, and can afford to rise towards NATO’s 5% Hague commitment without the same trade-offs against health, education and pensions that a stagnant economy would face. Second, and more directly, because the R&D mission proposed in this paper is itself defence and dual-use spending, it delivers both effects from the same pound: Section 4e below shows the mission closing a substantial share of the UK’s remaining NATO gap purely as a by-product of the productivity mission, without any additional headline defence budget.
The rest of this paper sets out how to get there: Sections 2-4 build the primary financing case (Scenario 1), Section 4d adds a second, self-financing reform on top of it (Scenario 2), and Sections 5-7 set out the parliamentary case and recommendations.
2. Why R&D — and Defence R&D Specifically — Can Solve It
R&D matters because productivity growth is ultimately the diffusion of better ideas, better processes and better technologies across the economy. The UK’s gross domestic expenditure on R&D was £72.6 billion in 2023, equal to 2.64% of GDP, down slightly from 2.69% in 2022 (ONS, UK gross domestic expenditure on R&D 2023). A parliamentary written answer states that the UK’s public R&D spending was £20.4 billion in 2025-26 and that, on average, £1 of public R&D leverages around £2 of private R&D investment in the long run (UK Parliament written answer). The Chancellor made the same crowding-in point in response to Chris Coghlan at the 2025 Spending Review, stating that every £1 of Government R&D crowds in £2 of private investment and returns £7 of wider economic benefit (Hansard, Spending Review 2025, 11 June 2025).
Defence R&D has a special role because it combines mission urgency, large-scale procurement, technical uncertainty and spillovers into civilian use. The canonical examples are familiar: radar, jet engines, nuclear technologies, satellite communications, the internet’s ARPANET lineage and GPS all emerged from or were accelerated by military and security needs. Antolin-Diaz and Surico’s long-run study uses 125 years of US quarterly data to show why these examples are not just anecdotes: military spending has unusually persistent output effects because it changes the composition of public spending towards R&D, and public R&D is the component whose effects remain significant a decade after the shock (Antolin-Diaz and Surico, ADS-LREGS-Mar24.pdf).
The paper’s mechanism is central to UK policy. A generic increase in public consumption has modest long-run effects; public investment has stronger but shorter-lived effects; public R&D has persistent effects on output, total factor productivity, innovation and private investment (Antolin-Diaz and Surico, ADS-LREGS-Mar24.pdf). In that framework, defence spending is economically powerful when it is not merely extra payroll, fuel or maintenance, but a portfolio of research, testbeds, prototypes, procurement pull-through and manufacturing capability. Surico’s defence-bonds memoranda make the same distinction in fiscal terms: borrowing is justified when it builds future productive capacity, not when it covers day-to-day costs (Surico, Surico_Defence_bonds.docx; Surico, Surico_BorrowingForDefence_oped080626.docx).
The newer NBER-CBO paper strengthens the case by estimating the effects of federally funded R&D directly. Campbell, Nelson, Schrag, Williams and Wroblewski report that US federal R&D spending was 179 billion US dollars in fiscal year 2024, split almost evenly between non-defence and defence, with Department of Defense R&D at 85.6 billion US dollars (Campbell et al., w35472.pdf; NBER working paper 35472). The paper estimates that additional federal R&D affects productivity for roughly three decades, with effects accelerating over the first 15 years and attenuating thereafter, and that a federal R&D dollar raises present-value GDP by several dollars under both deficit-financed and deficit-neutral scenarios (Campbell et al., w35472.pdf; NBER working paper 35472). The implication for a UK Parliament is profound: a five-year scorecard will systematically undervalue R&D, because the productivity gains materialise over a longer horizon than the Budget process normally rewards.
A newer patent-level study provides a third, independent cross-check and sharpens the mechanism further. Gazzani, Martinez, Natoli and Surico track the funding source (public or private) and the ownership (public or private) of every US patent granted since 1950, and estimate the dynamic effect of source-specific patent shocks on GDP and total factor productivity (TFP). They find that patents which are publicly funded but privately owned account for only about 2% of all filings, yet explain roughly one-fifth of medium-run forecast-error variance in GDP and TFP (Gazzani, Martinez, Natoli and Surico, Where Do Technology Shocks Come From? Public Funding and Private Ownership, 2026). Converting these patent shocks into dollar returns, the model-implied perpetuity-equivalent social return to publicly funded R&D is 1.91 — more than twice the 0.88 return to privately funded R&D — corresponding to a present-value output multiplier of 8.67 for public R&D against 4.01 for private R&D, and roughly three times the private-R&D crowd-in per dollar (52 cents versus 16 cents) (Gazzani, Martinez, Natoli and Surico, GMNS_TechShocks.pdf). These figures are close in spirit to, and corroborate independently of, both the NBER-CBO and Antolin-Diaz-Surico estimates already used in Section 2b below; this paper does not use them to revise its central £17 billion estimate, but treats them as reinforcing evidence that the underlying multiplier assumption is, if anything, conservative.
Crucially, Gazzani, Martinez, Natoli and Surico show the effect is conditional on ownership, not funding alone. Publicly funded patents that remain government-owned display weak average effects, masking a small number of highly consequential outliers; the large, reliable returns come specifically from publicly funded technologies that are privately owned and subsequently developed further by universities, research institutes and start-ups, which is also where the private-R&D crowd-in is concentrated (Gazzani, Martinez, Natoli and Surico, GMNS_TechShocks.pdf). Tellingly for this paper’s own proposal, the authors find that the historical effects specifically attributable to Department of Defense and NASA patents have been smaller, and often statistically insignificant, compared with NIH- and NSF-funded patents — precisely because DoD and NASA have historically retained a larger public-ownership share. The 1980 Bayh-Dole Act, which reassigned ownership of many federally funded US patents from government to universities and contractors, is the reason the Department of Defense’s own in-house ownership share fell from nearly 100% in 1950 to about 20% by 2015 (Gazzani, Martinez, Natoli and Surico, GMNS_TechShocks.pdf). The lesson for the UK is not that defence R&D is a weak vehicle for productivity gains; it is that the vehicle’s design determines the payoff. A defence R&D mission built around traditional MOD-owned, in-house procurement would risk repeating the weaker historical DoD pattern. A mission built around ARIA/DARPA-style grants and dual-use contracts, in which performing firms, universities and start-ups own the resulting IP and the Government retains only a non-exclusive licence for its own use — a British Bayh-Dole default — is designed to capture the much larger public-private multiplier this evidence identifies, and reinforces why Recommendations 1, 3 and 7 below emphasise dual-use, competitively contracted, privately deployable technologies rather than simple departmental spending increases.
This is why public R&D is not simply another departmental line. It is a fiscal technology. If the state chooses the right missions, shares risk with private capital and buys early versions of technologies that later become civilian platforms, it can change the economy’s growth path. Defence R&D is the most credible mission because the threat environment creates urgency, allies create scale, and the Ministry of Defence can provide early demand for technologies that private markets initially underfinance.
2b. Methodology: Deriving the £17 Billion Base Case (Scenario 1)
The starting point is the size of the gap this paper actually sets out to close. The OBR’s November 2025 productivity briefing states that its central forecast for underlying productivity growth — medium-term trend output per hour — was revised down from 1.3% to 1.0% (Office for Budget Responsibility). Rather than working from that 1.0% central case, this paper’s working baseline and base case (Scenario 1) takes the OBR’s own published upside AI scenario as the starting point: the OBR sets out an explicit upside scenario in which “the fading of temporary shocks alongside a larger boost from artificial intelligence (AI) pushes potential productivity growth up to 1.5 per cent” (OBR Briefing Paper No.9). The OBR’s central 1.0% case already prices in a modest, gradually building AI contribution of around 0.2 percentage points a year, and roughly a 2.5% level effect on productivity over the next decade, reflecting AI’s exposure across about 40% of UK occupations, mostly as a complement to workers rather than a substitute (OBR Briefing Paper No.9). Taking the OBR’s own upside scenario as the baseline — rather than crediting it as an afterthought against a larger ask — avoids double-counting AI’s effect while giving Parliament the OBR’s own most credible published upside path as the reference case. The House of Commons Library benchmark used in this paper is the UK’s pre-2008 historical labour-productivity norm of around 2% a year (House of Commons Library). Starting from the AI-inclusive 1.5% baseline, the residual gap public R&D must close is 0.5 percentage points a year — half the gap that would exist if none of the OBR’s AI upside were credited.
The model below converts the two main academic sources into a common spending yardstick to close that 0.5pp gap. It is deliberately simple, because the honest question for Parliament is one of order of magnitude rather than false precision. The ONS current-price GDP series reports 2025 GDP at £3,036.9 billion and the latest four quarters to 2026 Q1 at £3,071.4 billion, so the calculations round current UK nominal GDP to £3.0 trillion (ONS GDP series YBHA). Current public R&D is £20.4 billion in 2025-26, and current gross domestic R&D expenditure is 2.64% of GDP, as set out above (UK Parliament written answer; ONS, UK gross domestic expenditure on R&D 2023).
Box 1: An illustrative R&D-to-productivity conversion. Campbell et al. report that, over 2027-2056, an additional federal R&D dollar raises present-value GDP by $3.57 if deficit-financed and $3.82 if deficit-neutral before feedbacks (Campbell et al., w35472.pdf; NBER working paper 35472). The paper also states that productivity effects accelerate over the first 15 years after outlays, then attenuate over the next 15 years, so productivity is affected for roughly three decades (Campbell et al., w35472.pdf; NBER working paper 35472). To convert that into a growth-rate effect, assume an additional R&D flow equal to (x) of GDP is sustained, and approximate the resulting productivity gain as a linear addition (g) to annual GDP growth over 30 years. Using the Green Book’s 3.5% real social time preference rate for the first 30 years gives an annuity factor (A = 18.39) and a discounted “growth-ramp” factor (B = 238.50), where A is the sum, for t = 1 to 30, of (1.035)-t, and B is the sum, for t = 1 to 30, of t×(1.035)-t (HM Treasury Green Book discount-rate review). The NBER-CBO multiplier then implies (g=M x A/B). With (M=3.57), each additional 1% of GDP in sustained public R&D generates about 0.28 percentage points of annual growth over the transition.
That direct NBER-CBO conversion is a deliberately conservative lower-productivity-elasticity case for the UK proposal, because the UK policy design explicitly aims for far stronger private mobilisation. The written parliamentary answer and the Chancellor’s Spending Review response both use the rule of thumb that £1 of public R&D can leverage around £2 of private R&D in the long run (UK Parliament written answer; Hansard, Spending Review 2025). Scaling the NBER-CBO requirement from its 1.25 total R&D pounds per public pound to the UK target of 3.0 total R&D pounds per public pound, and applying it to the 0.5pp AI-inclusive gap, implies a conservative public-spending requirement of about 0.755% of GDP, or £23 billion a year.
Antolin-Diaz and Surico provide an independent cross-check. Their public R&D shock is normalised to raise government spending by 1% of GDP over the first year, and Figure 10 shows a public-R&D-composed shock raising real GDP by roughly 0.5-0.6% and adjusted TFP by roughly 0.4-0.45% at horizons of about 12-15 years, with positive responses of private investment and patents as well (Antolin-Diaz and Surico, ADS-LREGS-Mar24.pdf). Interpreting the 0.45% TFP level effect as the mature annual contribution of a permanently renewed 1% of GDP R&D impulse, again applying the £2 private for £1 public crowd-in target, and scaling to the 0.5pp AI-inclusive gap gives an optimistic requirement of about 0.37% of GDP, or £11 billion a year. The midpoint between the NBER-CBO conservative case and the ADS impulse-response case is the paper’s central estimate and Scenario 1 base case: about 0.565% of GDP, or £17 billion a year.
Scenario (AI-inclusive working baseline, closing 0.5pp gap)
Main empirical anchor
Additional public R&D required
Approx. £bn/year at £3.0tn GDP
Increase versus £20.4bn public R&D baseline
Implied total UK R&D intensity if £1 public crowds in £2 private
Optimistic
ADS public-R&D shock: TFP up about 0.4-0.45% after 12-15 years per 1% GDP shock
0.37% of GDP
£11bn
0.5x the current public budget
3.75% of GDP
Central (base case, Scenario 1)
Midpoint of ADS and NBER-CBO conversion
0.565% of GDP
£17bn
0.8x the current public budget
4.33% of GDP
Conservative
NBER-CBO $3.57 PV GDP multiplier, adjusted from 25p to £2 private crowd-in
0.755% of GDP
£23bn
1.1x the current public budget
4.91% of GDP
This is the paper’s primary planning envelope, and £17 billion a year is the figure worked through in full below — methodology, financing and debt/GDP impact — as this paper’s base case. It does still depend on the OBR’s upside AI scenario materialising; the practical implication for policy design is to build the R&D-bond programme so it can flex within the £11-23 billion range: begin at the £5 billion pilot scale common to all three cases, and let the Annual Defence R&D Productivity Statement (Recommendation 8) determine, using updated OBR productivity data, whether the mature target should remain at £17 billion or move within this range. Section 4d below sets out a second, complementary scenario — Scenario 2 — in which crediting the productivity effect of making patent purchases tax-deductible reduces the £17 billion base case further, to about £16 billion a year; Scenario 1 is worked through in full first, without any credit for that reform, so that its financing case stands on its own.
This derivation also reveals the strategic meaning of Chris Coghlan’s £5 billion to £20 billion R&D-bonds proposal. A £5 billion annual uplift would be a credible pilot and would move the UK towards US-style R&D intensity; a £20 billion annual uplift sits within the paper’s own £11-23 billion range and would push total R&D intensity towards South Korea’s frontier if it crowded in £40 billion of private R&D (Coghlan, R-Dbondsletter.pdf).
The benchmark comparison is demanding but not fanciful. World Bank data show 2023 R&D expenditure at 4.94% of GDP in Korea, 6.35% in Israel, 3.45% in the United States and 3.15% in Germany, compared with 2.68% for the United Kingdom on that dataset (World Bank R&D expenditure indicator). The optimistic case (3.75%) sits just above the German and US level; the central Scenario 1 base case (4.33%) sits roughly midway between the US/Germany band and Korea; the conservative case (4.91%) would take the UK almost exactly to Korea’s current R&D intensity.
3. The UK’s R&D and Defence-Tech Scale-Up Finance Gap
Britain has world-class research but a weaker system for turning invention into large domestic firms. The Royal Academy of Engineering’s 2025 deep-tech report says the UK is the world’s third-largest deep-tech hub and that UK deep-tech firms have raised 43.7 billion US dollars since 2019, but it also identifies a late-stage capital bottleneck, with domestic investor participation falling sharply from seed to late-stage rounds and an annual late-stage gap estimated at 4 billion to 11 billion US dollars (Royal Academy of Engineering Enterprise Hub). Surico’s scale-up finance paper frames the same issue as a transition failure: the UK does not lack ideas or founders; it lacks large, patient, domestically anchored capital at the stage where strategic firms either scale in Britain or sell, relocate or list abroad (Surico, UK_ScaleUP_Finance_Surico.pdf).
The defence-tech version of this gap is especially damaging. A small AI, cyber, autonomy, quantum, sensing, space or advanced-materials company may win a grant, a challenge prize or a pilot, but still fail to secure the growth capital needed for certification, production, NATO procurement credibility and export scale. The Ministry of Defence’s 2025 Defence Industrial Strategy aims for the UK to be a “leading tech-enabled defence power” by 2035, says the MOD R&D budget will be over £2 billion in 2026-27 and rise each year, and commits 10% of the MOD equipment budget to novel technologies (Defence Industrial Strategy 2025). That is the right direction, but it will not be enough if procurement, finance and industrial policy continue to operate in separate silos.
The UK already has the institutional components of a better system. Surico identifies the British Business Bank, British Patient Capital, Future Fund: Breakthrough, the National Security Strategic Investment Fund, DASA and Project FORGE as foundations for a rules-based co-investment architecture (Surico, UK_ScaleUP_Finance_Surico.pdf). The task is to turn pilots and fragmented funds into a predictable platform with enough scale to matter. A defence R&D mission should therefore include not only laboratory grants but also milestone-based procurement, first-customer commitments, co-investment rights, export finance and patient capital channels that allow firms to remain and grow in the UK.
Tax policy should also be retargeted towards additionality. The UK’s merged R&D expenditure credit has a 20% credit rate, while enhanced R&D intensive support gives eligible loss-making R&D-intensive SMEs an additional 86% deduction and a 14.5% payable credit (HMRC R&D tax relief guidance). These reliefs support a real market failure, because firms cannot capture all the spillovers from their R&D. Yet the Patent Box cost nearly £2.0 billion in 2023-24, and HMRC reports that large companies accounted for 95% of Patent Box relief while making up 28% of claimants (HMRC Patent Box statistics); the Martinez and Surico memo corroborates this with a lower government cost estimate of £1.3-1.4 billion a year and finds 94% of relief accrues to large firms, around 60% of it in manufacturing, a sector worth only about 8% of GDP (Martinez and Surico, Full_IP_Expensing_Memo.pdf). Surico’s scale-up paper therefore proposes reprioritising some Patent Box resources towards young, high-growth, financially constrained, high-spillover firms through grants, late-stage matching and British Business Bank co-investment (Surico, UK_ScaleUP_Finance_Surico.pdf).
The case for reprioritising the Patent Box is stronger than “it is poorly targeted” — the best available peer-reviewed evidence suggests it may not incentivise genuine invention at all. Gaessler, Hall and Harhoff’s study, published in Research Policy, finds that patent boxes reliably reduce patent transfers out of the adopting country by around 30%, but that this reflects income-shifting by multinationals relocating patent ownership for tax purposes, not new invention (Gaessler, Hall and Harhoff, GaesslerHallHarhoff20_patent_box_RP.pdf; DOI: 10.1016/j.respol.2020.104129). Critically, wherever the authors detect any effect of patent box introduction on actual invention activity — patent filings or R&D spending — it is negative, not positive, and patent boxes without a “development condition” requiring the underlying R&D to have occurred domestically function mainly as a tool for shifting reported income rather than a genuine innovation incentive (Gaessler, Hall and Harhoff, GaesslerHallHarhoff20_patent_box_RP.pdf). This directly undercuts the traditional justification for the Patent Box as an R&D incentive, and is the evidentiary basis for the reallocation proposed in Section 4d below, which redirects the Patent Box’s cost towards full expensing of intellectual property investment — an instrument with a demonstrated, quantified GDP payoff.
4. Financing the Solution: Fiscal Options
4a. Domestic options: gilts, reprioritisation and tax policy
The UK has three domestic ways to finance higher defence and R&D investment: tax rises, spending reallocations and borrowing. The Defence Investment Plan currently leans heavily on reallocations and efficiencies: the official funding explainer identifies £10.3 billion immediately through reallocating budgets, asset sales, Treasury support, procurement efficiency and departmental savings, with a further £4.7 billion to be confirmed at Budget 2026 (UK Government Defence Investment Plan explainer). Reallocation is necessary, because not every pound of current spending can be protected when security risks rise. But reallocation alone will not finance a productivity-changing R&D mission, and it risks cutting other forms of capital spending that also support growth.
Tax rises can fund day-to-day defence spending, but they are a poor default instrument for high-return R&D investment when the objective is to accelerate growth. Chris Coghlan’s letter to the Chancellor argued that if public R&D is increased by £5 billion to £20 billion a year and crowds in £10 billion to £40 billion of private R&D, Britain could move towards US or South Korean R&D intensity while strengthening defence (Coghlan, R-Dbondsletter.pdf). The same letter argues that where the growth return exceeds the interest cost, borrowing for R&D need not raise the debt-to-GDP ratio over the long run and may reduce it (Coghlan, R-Dbondsletter.pdf).
Domestic R&D bonds are therefore a sensible instrument if they are designed as a discipline, not a gimmick. The instrument should be ring-fenced, with proceeds legally restricted to eligible R&D, dual-use technology, defence innovation infrastructure and scale-up co-investment. It should begin with a pilot, publish independent project-selection criteria, require OBR and NAO reporting on additionality, and keep ordinary defence salaries and routine operating costs outside the bond. This approach follows Surico’s principle that day-to-day defence must remain inside the fiscal rules, while borrowing should be reserved for genuine investment that raises future productive capacity (Surico, Surico_Defence_bonds.docx; Surico, Surico_BorrowingForDefence_oped080626.docx).
Surico’s HM Treasury note makes the fiscal design more precise. It argues that the central question is borrowing composition: routine procurement and operating expenditure raise debt without materially expanding productive capacity, whereas borrowing for innovation, scale-up capital and production infrastructure can raise productivity and GDP within the forecast horizon, improving the odds of meeting the Chancellor’s fiscal rules (Surico, NBorrowingForDefence_HMT.pdf). The note proposes that Innovation Bonds should be issued through normal gilt issuance, with the innovation lying in ring-fenced allocation of proceeds to capital expenditure and financial transactions rather than current DEL (Surico, NBorrowingForDefence_HMT.pdf). That is an important distinction: the bond label should not be sold as free fiscal space, but as a commitment device that prevents debt drifting into lower-return procurement-heavy channels (Surico, NBorrowingForDefence_HMT.pdf).
The same note sets out the balance-sheet route for scale-up finance. Government equity subscriptions into the British Business Bank and the National Security Strategic Investment Fund would be financial transactions, increasing public financial assets rather than directly worsening the current budget balance, while targeting later-stage defence and dual-use firms that often relocate to the United States when they reach capital-intensive stages (Surico, NBorrowingForDefence_HMT.pdf). It also argues that defined contribution pension schemes are well suited to long-duration growth assets, and that government cornerstone equity can crowd in institutional capital alongside sustained European defence-demand visibility (Surico, NBorrowingForDefence_HMT.pdf).
The Treasury Committee evidence supports the same hierarchy. In oral evidence on the Spending Review, Paolo Surico told MPs that the “main driver of innovation is research and development” and that the historical evidence points to R&D as the Government spending with the highest return for productivity, real wages and living standards (Treasury Committee oral evidence, 17 June 2025). Chris Coghlan’s questioning in that session focused on the best way to increase productivity, which Surico answered by linking productivity to efficiency, innovation and R&D (Treasury Committee oral evidence, 17 June 2025). The Committee’s 2026 publications list also shows an active correspondence stream on “defence spending and finance” and the “Defence Mechanism,” confirming that Parliament is scrutinising not only the level of defence spending but the financing architecture behind it (Treasury Committee publications API).
Financing Without Alarming Gilt Markets
The central estimate above is large enough to require market discipline, but not so large that it must destabilise the gilt market if phased and classified correctly. The DMO’s 2026-27 financing remit sets a Net Financing Requirement of £257.1 billion, financed by £252.1 billion of gilt sales and a £5.0 billion net Treasury-bill contribution; the same remit includes £12.0 billion of planned green gilt sales and £23.5 billion of index-linked issuance, equal to 9.3% of total gilt sales (DMO Financing Remit Announcement 2026-27). The Bank of England’s current quantitative-tightening programme is also material: at its September 2025 meeting, the MPC voted to reduce the stock of gilts held in the Asset Purchase Facility by £70 billion over October 2025 to September 2026, to £488 billion (Bank of England APF gilt sales market notice). Mid-2026 market conditions are therefore not benign: Bloomberg showed the 10-year gilt yield at 4.75% and the 30-year gilt yield at 5.47% on 17 June 2026, while a later yield-curve snapshot put the 10-year gilt yield at 5.09% on 23 July 2026 (Bloomberg UK Rates & Bonds; Central Bank Watch UK yield curve).
The September 2022 lesson is that markets do not object only to borrowing; they object to unscored, unfunded, weakly governed borrowing. The BBC’s reconstruction of the mini-Budget records £45 billion of unfunded tax cuts, no OBR forecast published alongside the statement, a sharp fall in sterling and a market reaction to an extra £72 billion funding need (BBC). The Bank of England intervened on 28 September 2022 because dysfunction in long-dated gilts posed a material risk to UK financial stability, announcing temporary purchases of long-dated UK government bonds on whatever scale was necessary to restore orderly market conditions (Bank of England). An Innovation Bond programme must therefore be designed to be the opposite of the mini-Budget: pre-scored by the OBR, governed by a published use-of-proceeds framework, phased through the normal remit, and tied to assets and productivity rather than permanent current giveaways.
The first protection is fiscal-rule compatibility. The current fiscal framework’s stability rule is to move the current budget into balance so that day-to-day costs are met by revenues and the Government borrows only for investment, while the investment rule targets debt, defined as public sector net financial liabilities, falling as a share of the economy (HM Treasury, A strong fiscal framework). Surico’s Treasury note is directly aligned with that framework: Innovation Bonds should be issued through standard gilt issuance, with proceeds ring-fenced for capital expenditure and financial transactions rather than current DEL, because the objective is compositional discipline rather than invented fiscal space (Surico, NBorrowingForDefence_HMT.pdf). Equity subscriptions into the British Business Bank or NSSIF are especially important because they are financial transactions that increase public financial assets rather than current spending, reducing pressure on the current-budget rule while retaining intellectual property, production capacity and future tax bases in the UK (Surico, NBorrowingForDefence_HMT.pdf).
The second protection is phasing. On Scenario 1, the paper’s primary AI-inclusive base case, the mature public R&D uplift is about £17 billion a year, equal to 6.7% of the DMO’s 2026-27 planned gross gilt sales; a ten-year linear ramp would add around £1.7 billion of annual financing each year, equal to only 0.7% of that remit (DMO Financing Remit Announcement 2026-27). Crediting the productivity contribution of making patent purchases tax-deductible (Scenario 2, Section 4d) reduces this further, to about £16.05 billion a year, or 6.4% of the remit. The chart below shows how gently this ramp actually builds: the annual increment starts at just £1.7 billion in 2026-27 and rises in equal £1.7 billion steps to reach the full £17 billion mature level only by 2035-36, with Scenario 2’s IP-expensing credit trimming each year’s increment slightly further.
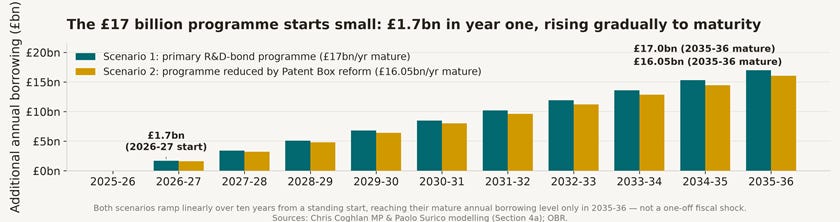
Annual borrowing increment under Scenario 1 and Scenario 2, 2025-26 to 2035-36
Figure: annual additional public R&D borrowing by fiscal year under Scenario 1 (£17bn primary, teal) and Scenario 2 (£16.05bn IP-expensing-reduced, gold), both ramping linearly from a £1.7 billion first-year increment. Source: author’s model, based on DMO and OBR data cited above.
The first Budget should therefore authorise a £5 billion pilot, publish a ten-year envelope with OBR certification, and release subsequent tranches only after the Annual Defence R&D Productivity Statement verifies project quality, private crowd-in and procurement conversion. This pacing matters more than the label: a £1.7 billion to £2 billion predictable annual increment inside a transparent remit is a manageable addition to an already large gilt programme, in clear contrast to an unphased, unscored lump-sum announcement of the kind that triggered the September 2022 market reaction.
The third protection is market design. Innovation Bonds should be sold through the existing DMO programme rather than as an ad hoc off-market facility, because the DMO’s remit is built around openness, predictability and transparency, regular issuance across the maturity spectrum, and benchmark liquidity (UK Debt Management Report 2026-27). The Treasury can still brand eligible conventional or index-linked tranches as “UK Growth Bonds” or “Innovation Bonds,” as green gilts already show that use-of-proceeds reporting can coexist with standard marketable gilt issuance (UK Debt Management Report 2026-27). The maturity mix should lean towards the natural investor base for long-duration assets — defined-benefit pension schemes, buyout insurers and other liability-matching investors — while avoiding excessive concentration at any single point on the curve. Surico’s note also argues that defined contribution pension capital is well suited to long-duration growth assets, and that government cornerstone equity can crowd in institutional investors alongside multi-year defence-demand visibility (Surico, NBorrowingForDefence_HMT.pdf).
The fourth protection is diversification away from pure gilt supply. The Joint Defence R&D Bond Facility proposed in Section 4b would pool part of the financing need with allies, so that eligible NATO, AUKUS or European projects are financed through common or jointly guaranteed issuance rather than entirely through the UK curve. NS&I products could provide a smaller retail channel for patriotic savings, but should be capped and priced to avoid expensive displacement of ordinary gilt financing. Reprioritisation should also remain part of the package: Surico’s note recommends redirecting poorly targeted tax expenditures such as the Patent Box towards scale-up capital, reserving new borrowing for innovation-led capital formation (Surico, NBorrowingForDefence_HMT.pdf).
The communications rule is simple: publish the OBR-certified ten-year plan before issuance, not after market pressure has begun. The announcement should include the spending envelope, eligible-use taxonomy, expected national-accounts treatment, OBR productivity and fiscal-rule assessment, DMO issuance plan, NAO audit route, and annual reporting milestones. Investors should be told precisely what would stop the programme as well as what would expand it: if projects fail additionality tests, if private crowd-in disappoints, or if the OBR judges the fiscal rule at risk, future tranches pause. That is the discipline that distinguishes investment borrowing from wishful borrowing.
The conclusion is therefore practical. A mature primary requirement of roughly £17 billion a year under Scenario 1 (falling to about £16 billion under Scenario 2 once the patent-box reform in Section 4d is credited), phased over ten years, is a manageable national choice and not a gilt-market shock in its annual increments. It can avoid a September 2022-style failure if it is investment-classified, OBR-certified, ring-fenced, phased through the DMO, partly financed through financial transactions and pension-capital crowd-in, and partly pooled with allies.
4b. Joint Defence Bonds with Allies
A domestic R&D bond should be complemented by an allied Joint Defence R&D Bond Facility. The strategic rationale is straightforward: the UK is not trying to defend itself alone, and it should not finance the industrial base for deterrence alone. NATO capability gaps, AUKUS technology development, European air and missile defence, undersea capability, drones, cyber resilience and secure space infrastructure are shared allied needs. Joint issuance can match that reality by pooling credit risk, aggregating demand, increasing bond-market scale and lowering the funding cost for countries whose individual borrowing costs are higher than the facility’s blended or guaranteed cost.
The EU has already shown workable precedents. SURE offered up to €100 billion of favourable loans to member states during the pandemic, underpinned by voluntary guarantees from member states allocated by GNI share, and the Commission raised €98.4 billion through social bonds by December 2022 (European Commission SURE). NextGenerationEU is larger: the Commission expects to raise up to €637 billion by end-2026 within a maximum envelope of €806.9 billion, with repayment running over decades and borrowing backed by EU budget headroom and own-resources arrangements (European Commission NextGenerationEU). These instruments are not perfect analogues for the UK, because they rest on EU legal structures, but they prove that large pooled issuance can create liquid, programme-linked debt for shared public purposes.
The defence-specific precedent is now SAFE. The European Commission says SAFE was adopted by the Council on 27 May 2025, entered into force on 29 May 2025, and will provide up to €150 billion in competitively priced, long-maturity loans for defence capability investments, financed through EU borrowing and benefiting from the EU’s strong credit rating (European Commission SAFE). The European Parliament’s legislative tracker describes SAFE as a voluntary scheme for common defence procurement, with long-maturity loans backed by EU budget headroom, maximum loan duration of 45 years and a 10-year grace period for principal repayments (European Parliament legislative train). SAFE is therefore not merely an accounting device; it is a live model of joint borrowing, defence industrial policy and allied procurement discipline. Surico’s In Defence of Defence Innovation Bonds explicitly argues that framing UK defence bonds alongside possible UK participation in SAFE is more coherent than relying only on country-specific precedents, because the industrial problem is European as well as national (Surico, NIn-Defence-of-Defence-Bonds.pdf).
The UK should seek either associate access to SAFE where legally and politically possible, or build a parallel facility with willing allies such as Canada, Norway, Japan, Australia, New Zealand and European partners. The facility should have five design features. First, it should be use-of-proceeds based, restricted to defence R&D, dual-use technologies, shared test infrastructure, critical production capacity and jointly procured platforms. Second, it should use proportional guarantees or a paid-in reserve so that each sovereign’s exposure is transparent. Third, it should require multi-country projects or clear interoperability benefits. Fourth, it should publish an annual portfolio report with technical milestones, procurement outcomes, UK industrial participation and crowding-in ratios. Fifth, it should forbid routine current spending.
This structure would reduce risk in two ways. It would spread sovereign credit risk across participating states rather than loading it entirely onto one Treasury, and it would reduce project risk by forcing countries to aggregate demand around common systems rather than duplicating small national programmes. It would not eliminate risk, and the cost would depend on the guarantee design, investor appetite and legal seniority; Bruegel has cautioned that EU common debt does not automatically trade as a pure safe asset in the way some advocates assume (Bruegel). But the correct conclusion is to design the facility carefully, not to reject joint issuance outright.
Mario Draghi’s address to the “High Level Conference – One Year After the Draghi Report,” held in Brussels on 16 September 2025 alongside Commission President Ursula von der Leyen, makes the same case at head-of-government level, and independently reinforces this paper’s logic (Draghi, One Year After the Draghi Report, 16 September 2025). Draghi reports that the EU’s estimated annual investment requirement for 2025-31 has risen to about €1,200 billion, with the public share climbing from 24% to 43% as defence, being mainly publicly funded, takes a growing share of that need, while EU public debt is on course to rise ten percentage points over the next decade to 93% of GDP even before new defence spending is added (citing the ECB Blog, 25 July 2025, and the European Commission’s Debt Sustainability Monitor 2024). Faced with the same fiscal-space constraint the UK confronts, Draghi’s answer is explicit: he calls for “common debt for common projects” — joint issuance to finance “breakthrough innovation, scale technologies, defence R&D, or energy grids—where fragmented national spending can no longer deliver.” That is close to a direct endorsement of the Joint Defence R&D Bond Facility proposed here, and it comes with a quantified justification: Draghi cites modelling showing that “a modest 2% increase in total factor productivity over a decade could cut the public finance burden by one-third,” and argues that projects which “raise output faster than interest costs” gradually restore fiscal space and make wider investment easier to finance — the same mechanism modelled for the UK in Section 4c below. Notably, Draghi’s own speech opens by citing Antolin-Diaz and Surico’s The Long-Run Effects of Government Spending as supporting evidence, the same paper that anchors Section 2 of this analysis, underlining that the UK and EU are drawing on a shared and converging evidence base (Draghi, One Year After the Draghi Report, 16 September 2025; Antolin-Diaz and Surico, ADS-LREGS-Mar24.pdf). Draghi also notes that in 2024 the US produced 40 large AI foundation models against 15 for China and just 3 for the EU (citing the Stanford AI Index 2024) — a frontier gap that reinforces why the UK cannot rely solely on absorbing foreign AI productivity gains and needs its own defence-tech and dual-use R&D base.
4c. Impact on UK Debt-to-GDP
A fair objection to any new borrowing programme is that it could put debt-to-GDP on a permanently higher path. This section models that question directly, using the OBR’s own November 2025 Economic and Fiscal Outlook as the baseline and extending it a further five years on the OBR’s stated long-run nominal growth assumptions. The OBR’s November 2025 EFO forecasts public sector net debt at 95.0% of GDP in 2025-26, rising to a peak of 97.0% in 2028-29 before falling to 96.1% by 2030-31 as the Government’s fiscal rules bite (OBR, November 2025 Economic and Fiscal Outlook). This paper extends that baseline to 2035-36 by holding debt-to-GDP flat at 96.1%, consistent with the Government’s stated fiscal-rule objective of stabilising debt as a share of the economy.
Against that baseline, this paper models a financing path in which the R&D-bond programme ramps in from a pilot to its mature scale over ten years, using the £17 billion AI-inclusive Scenario 1 base case from Section 2b as the working baseline, while the resulting productivity gain — phased in proportionally as cumulative borrowing builds — raises nominal GDP growth and, through a standard 40% marginal receipts-to-GDP ratio consistent with OBR forecasts, generates additional tax revenue that offsets part of the annual borrowing. The results show a clear pattern:
· Years 1-4: debt-to-GDP rises modestly above the OBR baseline as new borrowing outpaces the still-building productivity dividend, peaking at around +0.22 percentage points of GDP above baseline in 2029-30 under Scenario 1’s £17 billion programme.
· Years 5-7: the productivity dividend and resulting tax receipts catch up with and then overtake the cost of borrowing; debt-to-GDP crosses back below the OBR baseline by 2032-33.
· Years 8-10: the programme becomes net debt-reducing. By 2035-36, debt-to-GDP is projected at 94.02% under Scenario 1’s £17 billion programme, compared with a 96.1% OBR-baseline path — a reduction of about 2.1 percentage points of GDP relative to doing nothing.
The chart below also plots a cautionary “no productivity payback” case, in which the same £17 billion a year is borrowed but none of the promised productivity gains materialise. In that risk scenario debt-to-GDP would reach 98.23% by 2035-36 — about 2.1 percentage points above the OBR baseline, though still short of 100% — underlining why the OBR-certification, phasing and pause triggers set out in Section 4a are not optional extras but the mechanism that protects the gilt market if the productivity assumptions turn out to be wrong.
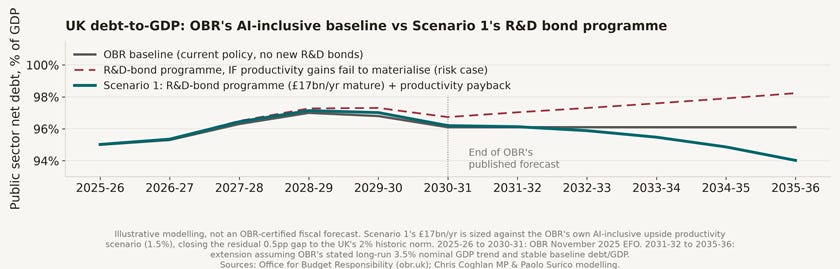
UK debt-to-GDP: OBR’s AI-inclusive baseline vs Scenario 1’s R&D bond programme
Fiscal year
OBR baseline (%GDP)
Scenario 1 programme, £17bn/yr AI-inclusive (%GDP)
No productivity payback risk case (%GDP)
2026-27
95.3
95.4
95.4
2028-29
97.0
97.1
97.3
2030-31
96.1
96.2
96.7
2032-33
96.1
95.9
97.3
2035-36
96.1
94.0
98.2
This modelling is deliberately illustrative rather than an OBR-certified forecast: it assumes a front-loaded, roughly linear convergence of productivity gains with cumulative borrowing, whereas the NBER-CBO evidence in Section 2 suggests real-world payback from R&D more plausibly unfolds over 15 to 30 years (Campbell et al., w35472.pdf). A slower, more realistic payback path would push the peak excess debt-to-GDP slightly higher and delay the crossover below baseline by a few years, but would not change the qualitative conclusion: because R&D productivity gains raise output faster than the interest cost of financing them, a well-designed programme is debt-reducing over the medium term rather than debt-increasing — precisely the mechanism Draghi identifies for Europe and Coghlan’s own letter to the Chancellor sets out for the UK (Draghi, One Year After the Draghi Report, 16 September 2025; Coghlan, R-Dbondsletter.pdf).
The same arithmetic can be read directly as an annual budget deficit (public sector net borrowing, PSNB) rather than a stock of debt, which is the metric most directly relevant to gilt-market reception and each year’s Budget arithmetic. Starting from the OBR’s own November 2025 EFO published PSNB path — falling from £138.3 billion in 2025-26 to £67.2 billion by 2030-31 — Scenario 1’s £17 billion programme adds its annual financing ramp on top, taking the deficit to about £75.7 billion in 2030-31 and £159.6 billion by 2035-36 once the programme reaches maturity and the OBR’s own forecast horizon has been extended on the flat debt/GDP assumption used throughout this section. Scenario 2’s IP-expensing-reduced £16.05 billion path (Section 4d) sits marginally below Scenario 1 throughout, at £158.6 billion by 2035-36. Neither figure is netted for the productivity dividend’s offsetting tax revenue modelled above; they show the gross annual financing requirement in cash terms, which is the number that matters for DMO issuance planning and gilt-market communication.
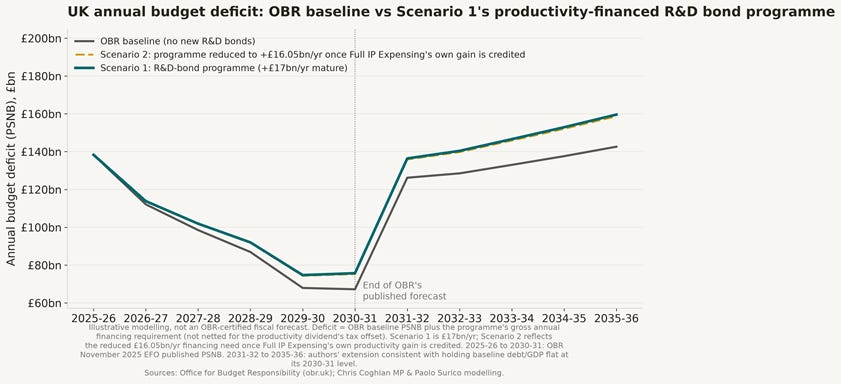
UK annual budget deficit (PSNB): OBR baseline vs Scenario 1’s £17bn programme and Scenario 2’s IP-expensing-reduced £16.05bn path
Fiscal year
OBR baseline PSNB (£bn)
+ Scenario 1, £17bn/yr (£bn)
+ Scenario 2, £16.05bn/yr (£bn)
2025-26
138.3
138.3
138.3
2027-28
98.5
101.9
101.7
2029-30
67.9
74.7
74.3
2030-31
67.2
75.7
75.2
2032-33
128.5
140.4
139.7
2035-36
142.6
159.6
158.6
Source: 2025-26 to 2030-31 baseline is the OBR’s published PSNB forecast (OBR, November 2025 Economic and Fiscal Outlook). 2031-32 to 2035-36 has no official OBR forecast and is extended by the authors, consistent with the flat-debt/GDP assumption used elsewhere in Section 4c, as the year-on-year change in baseline public sector net debt required to hold debt-to-GDP constant at its 2030-31 level. Scenario additions are each programme’s gross annual financing requirement (Sections 2b, 4d) and are not netted for the offsetting tax revenue modelled in the debt-to-GDP analysis above.
4d. Scenario 2: Reallocating the Patent Box to Fund Self-Financing Full IP Expensing
Sections 2-4c above worked Scenario 1 — the £17 billion R&D-bond programme — through in full, in its own right, crediting it with no help from any other reform. This section sets out a second, complementary scenario, Scenario 2, which layers one further, self-financing tax reform on top of Scenario 1 and reduces its mature borrowing requirement to about £16 billion a year. Scenario 2 does not replace Scenario 1: it is worked out as an addition to it, and the case for Scenario 1 stands independently of whether Scenario 2 is also adopted.
Section 3 set out the evidence that the Patent Box, at a cost of roughly £1.3 billion to £2.0 billion a year, is a poorly targeted innovation incentive: 94-95% of its relief flows to large firms, and Gaessler, Hall and Harhoff’s peer-reviewed evidence finds no positive — and possibly a negative — effect on genuine invention activity, with its only robust effect being a roughly 30% reduction in patent transfers abroad, a tax-planning outcome rather than an economic one (HMRC Patent Box statistics; Martinez and Surico, Full_IP_Expensing_Memo.pdf; Gaessler, Hall and Harhoff, GaesslerHallHarhoff20_patent_box_RP.pdf). This paper proposes abolishing the Patent Box and reallocating its cost.
The Martinez and Surico memo identifies where that money should go instead, and explains precisely why it works. The mechanism starts with a tax asymmetry: the UK currently requires firms to amortise the cost of purchased intellectual property over 15 to 25 years for tax purposes, which reduces the present value of tax relief to only 45-60% of the up-front cost — in sharp contrast to the 100% first-year relief plant and equipment already receives under full expensing. Cloyne, Martinez, Mumtaz and Surico’s companion research identifies this asymmetric tax treatment of intangible-asset amortisation as a first-order distortion in the corporate tax base: because purchased IP is taxed far less favourably than physical capital, firms systematically under-invest in acquiring and commercialising external intellectual property relative to the economically efficient level (Cloyne, Martinez, Mumtaz and Surico, CMMS.pdf). Removing that distortion — by moving to full, immediate expensing of IP investment, mirroring the regime already available for plant and equipment — directly raises the after-tax market value of intangible-intensive firms, which in turn is what drives more investment in acquiring, licensing and commercialising patents and other IP (Cloyne, Martinez, Mumtaz and Surico, CMMS.pdf; Martinez and Surico, Full_IP_Expensing_Memo.pdf). The memo estimates this reform would cost approximately £900 million a year and raise UK GDP by an estimated 0.24-0.32% (central estimate 0.28%) over four to five years (Martinez and Surico, Full_IP_Expensing_Memo.pdf). That is a far higher payoff per pound than the OBR’s own costing of full expensing for plant and equipment, which the OBR estimates raises GDP by only 0.11% in the short run and 0.16% in the long run for a much larger annual cost of about £10 billion (Martinez and Surico, Full_IP_Expensing_Memo.pdf). Chris Coghlan’s own letter to the Exchequer Secretary to the Treasury made the identical case directly to the Government: full IP expensing was projected to deliver “two to four times more GDP growth” than the OBR’s physical-expensing benchmark for roughly a tenth of the up-front cost, with benefits materialising within three to four years and persisting for at least a decade (Coghlan, ExchequerSecretaryLetter11thMarch.pdf).
The reform is also progressive in its effect across firm size, which matters because the existing R&D tax-credit and Patent Box regimes are not. Large firms already capture around 80% of R&D tax-credit spending and 94-95% of Patent Box relief, because both instruments mainly reward internal innovation — R&D a firm conducts and patents itself — which large incumbents dominate (Martinez and Surico, Full_IP_Expensing_Memo.pdf). Full IP expensing instead targets external innovation: the purchase, licensing and adoption of intellectual property developed elsewhere, which is disproportionately how smaller and scaling firms access frontier technology they cannot afford to develop in-house. Correcting the amortisation penalty therefore closes a gap in the tax system that current innovation incentives leave wide open, rather than adding a third instrument on top of two that already favour the same large firms.
The reallocation is close to self-financing on its own fiscal terms. Using HMRC’s official £2.0 billion Patent Box cost as the central abolition saving (or the memo’s more conservative £1.3 billion government estimate as a floor), funding the £900 million full IP expensing cost leaves a net fiscal saving of £1.1 billion a year (central) or £0.4 billion a year (conservative). Because Patent Box abolition more than covers the cost of full IP expensing, this reform requires no net new borrowing in its own right: it is genuinely self-financing, in contrast to the R&D-bond programme itself, which does require phased gilt issuance as set out in Section 4a. To the extent any transitional financing gap arises — for example if implementation timing means the Patent Box saving and the IP-expensing cost do not land in exactly the same fiscal year — the sums involved are trivial relative to the DMO’s gilt programme: even a full £900 million transitional financing need would equal only about 0.4% of the DMO’s 2026-27 gross gilt remit of £252.1 billion (DMO Financing Remit Announcement 2026-27).
But the reform’s value goes beyond its own fiscal saving: because full IP expensing itself raises measured productivity, it reduces how much the R&D-bond programme needs to borrow to hit the same 2% productivity target. Section 2b’s Scenario 1 base case is sized to close a residual 0.5 percentage-point productivity gap entirely through the R&D-bond programme. But full IP expensing’s own 0.28% central GDP-level effect, phased in linearly over its first five years, is equivalent to a permanent productivity growth-rate contribution of about 0.028 percentage points a year once amortised across the ten-year modelling horizon. Crediting that contribution against the same 0.5 percentage-point target leaves the R&D-bond programme itself needing to close a smaller residual of only 0.472 percentage points a year, cutting the mature borrowing requirement from £17.0 billion to £16.05 billion a year — a reduction of about £0.95 billion a year (roughly 5.6%). Combined with the £1.1 billion a year net fiscal saving from Patent Box abolition itself, this means the patent-box reform pays for the smaller, reduced R&D-bond programme twice over: once through its own fiscal saving, and again through the lower borrowing the R&D-bond programme needs once IP expensing’s productivity contribution is credited.
Crucially, the two reforms are complementary rather than substitutes, because they operate on different timescales. Full IP expensing supplies an early, front-loaded productivity kick: its GDP effect ramps up over years 1-5 and then holds at a constant 0.28% level effect, contributing an estimated 0.056 percentage points a year to productivity growth in each of years 1-5 before fading to zero as its one-off level effect is fully absorbed into the economy. The R&D-bond programme’s own uplift, by contrast, builds slowly but permanently: it starts near zero and rises smoothly to its full 0.5 percentage-point contribution only by year 10 (2035-36), consistent with the NBER-CBO evidence that R&D’s productivity effects accelerate over 15 years and persist for three decades (Campbell et al., w35472.pdf). The productivity trajectory chart below traces the resulting combined path: starting from the OBR’s AI-inclusive baseline (rising from 0.5% to 1.5% by 2030-31), IP expensing’s early kick lifts productivity growth in the near term while the R&D-bond programme’s slower-building uplift takes over as IP expensing’s contribution fades, and the two together reach exactly the UK’s historic 2% productivity norm by 2035-36.
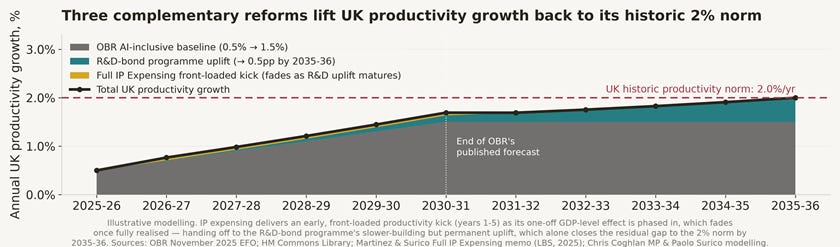
Annual UK productivity growth returning to the 2% historic norm by 2035-36, combining the OBR’s AI-inclusive baseline, the R&D-bond programme’s uplift and full IP expensing’s early productivity kick
On a pound-for-pound basis, full IP expensing is also a better use of money than simply adding it to the public R&D mission. Scaling this paper’s own Scenario 1 relationship between R&D spending and productivity (Section 2b: £17 billion a year delivers a 0.565 percentage-point permanent growth effect), redirecting the same £900 million to the R&D-bond programme instead of IP expensing would generate a cumulative GDP level effect of only around 0.14% after four to five years — roughly half of full IP expensing’s 0.24-0.32% effect for the identical outlay. Full IP expensing therefore delivers roughly twice the near-term GDP payoff per pound of an equivalent addition to the public R&D programme, consistent with both the LBS memo’s own claims and Coghlan’s letter (Martinez and Surico, Full_IP_Expensing_Memo.pdf; Coghlan, ExchequerSecretaryLetter11thMarch.pdf). This is why the reallocation should fund full IP expensing first, crediting its productivity contribution against the R&D-bond programme’s mature target as set out above, with the residual net fiscal saving (£0.4-1.1 billion a year) available to support the reduced programme’s early pilot years.
Layering this reform onto the primary R&D-bond programme improves the debt-to-GDP picture modelled in Section 4c even further. Because the IP-expensing component is self-financing and its own GDP effect (modelled as a persistent level effect, ramping in linearly over years 1-5 following the OBR’s own full-expensing methodology) boosts tax receipts from year one — while the R&D-bond borrowing itself falls to £16.05 billion a year on the reduced, IP-credited path — the combined programme has a smaller transitional debt-to-GDP cost than the primary R&D-bond programme alone, and falls below the OBR baseline almost immediately, from 2026-27 rather than 2032-33. By 2035-36, the combined programme puts debt-to-GDP at roughly 93.09%, some 3.0 percentage points below the OBR’s no-action baseline of 96.1%, compared with 2.1 percentage points below baseline for the primary R&D-bond programme alone.
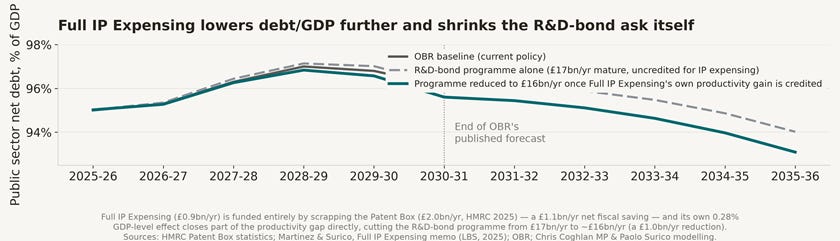
Reforming the Patent Box and crediting its productivity effect reduces R&D-bond borrowing and strengthens the debt/GDP case further
Fiscal year
OBR baseline (%GDP)
Primary R&D-bond programme alone, £17bn/yr (%GDP)
Reduced programme + Patent Box reform, £16.05bn/yr (%GDP)
2026-27
95.3
95.4
95.3
2028-29
97.0
97.1
96.8
2030-31
96.1
96.2
95.6
2032-33
96.1
95.9
95.1
2035-36
96.1
94.0
93.1
The policy conclusion is straightforward: reforming the Patent Box is not a painful trade-off against the R&D-bond programme, but a complementary reform that strengthens it. It should be legislated alongside the R&D-bond programme, not treated as a separate, lower-priority tax measure.
4e. Closing the Gap to NATO’s 2035 Defence-Spending Commitments
The defence and dual-use R&D mission modelled throughout this paper is, by its own design, defence spending — and NATO allies agreed at the 2025 Hague Summit to invest 5% of GDP annually in defence and security-related spending by 2035, split between 3.5% for core defence requirements and 1.5% for broader security, resilience, infrastructure, innovation and defence industrial-base investment (NATO). This section sets out, illustratively, how much of the remaining gap to that commitment the R&D mission alone would close, treating the mission’s spend as defence and dual-use R&D that counts towards NATO’s defence-expenditure definition, consistent with this paper’s framing of the mission’s “defence R&D as the anchor mission” (Section 2).
The UK’s current stated defence-spending trajectory, interpolated from the Strategic Defence Review’s own figures — 2.3% of GDP today, rising to 2.5% by 2027, with an unquantified “ambition” of 3% “in the next Parliament” (Strategic Defence Review 2025) — is modelled here as reaching 3.0% of GDP by 2030-31 and holding flat thereafter absent any new commitment. Layering the R&D mission’s own GDP contribution on top of that baseline, using the same ramp shape as the debt/GDP model in Section 4c, shows the mission closing a substantial share of the remaining gap to NATO’s targets by 2035-36:
· Scenario 1’s £17 billion a year mature R&D mission (AI-inclusive baseline, adding 0.57 percentage points of GDP to defence-related spending at maturity) would take UK defence-related spending to about 3.56% of GDP by 2035-36 — just above the NATO 3.5% core target, and closing about 28% of the remaining gap to the full 5.0% Hague commitment — without requiring any additional headline defence budget beyond the R&D mission itself.
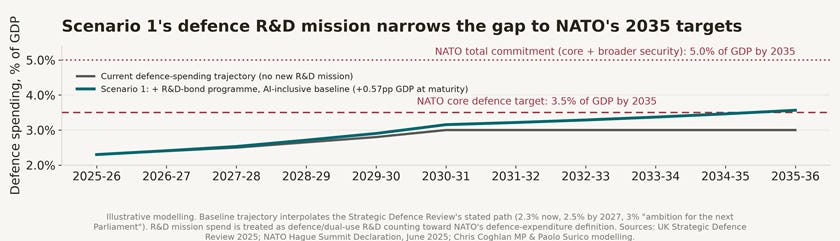
A defence R&D mission closes much of the gap to NATO’s 2035 targets under Scenario 1
Fiscal year
Current trajectory (%GDP)
+ Scenario 1 mission, £17bn/yr (%GDP)
2025-26
2.30
2.30
2027-28
2.50
2.53
2030-31
3.00
3.15
2032-33
3.00
3.29
2035-36
3.00
3.56
This is illustrative modelling, not a claim about how the Government would formally classify R&D spending under NATO reporting rules, and it should be read alongside the caveats in Section 4c about the pace of productivity payback. But the strategic logic holds regardless of the precise numbers: because a defence R&D mission is simultaneously a productivity investment and defence expenditure, it is one of the few available policy instruments that helps the UK meet its NATO commitments and its economic growth objectives with the same pound of spending, rather than requiring a trade-off between the two.
5. Chris Coghlan MP’s Perspective: A Voice from Parliament
Chris Coghlan’s contributions in the House give this paper its parliamentary spine. In the Finance Bill debate, he linked low productivity to the fiscal squeeze, warning that the UK will not escape higher taxes, ageing pressures, crumbling public services and higher debt unless it solves the productivity crisis (Hansard, Finance Bill, 27 November 2024). He also criticised borrowing that fails to raise growth, citing the OBR’s view that near-term growth effects of broad fiscal choices can reverse over five years (Hansard, Finance Bill, 27 November 2024). The distinction is crucial: the issue is not whether borrowing is always good or always bad, but whether it finances productive capacity.
At the Spring Statement, Coghlan put defence R&D directly to the Chancellor. He declared an interest as a London Business School alumnus, recalled asking the Chancellor to examine a London Business School paper on public R&D and defence spending, and asked whether defence spending focused on public R&D could “not only keep us safe, but raise productivity and boost economic growth” (Hansard, Spring Statement, 26 March 2025). The Chancellor replied that new defence investment should be used for innovation, R&D and new technologies as the UK moves towards 2.5% of GDP (Hansard, Spring Statement, 26 March 2025).
At the Spending Review, Coghlan sharpened the point from defence R&D to crowding in scale-up capital. He told the House that the economy would “only escape its difficult place if we raise economic productivity,” said he had introduced the Chancellor to Paolo Surico’s work on public R&D and defence spending, and asked how the Government would ensure that R&D crowds in “innovative, high-tech start-ups and venture capital firms” (Hansard, Spending Review 2025, 11 June 2025). That is the right test for policy design. A successful defence R&D strategy is not measured by the size of the grant line but by the firms, patents, prototypes, factories, exports and productivity gains it creates.
6. Policy Recommendations
Create a ten-year UK Defence and Dual-Use R&D Mission with a quantified productivity target, working from an AI-inclusive baseline (Scenario 1), and defaulting to private ownership of the IP it funds. The mission should begin with an additional £5 billion a year, scale towards a mature base-case target of £17 billion a year (falling to about £16 billion a year under Scenario 2 once the Patent Box reform in Recommendation 6 is credited) as project quality and crowding-in evidence are proven, with the Annual Defence R&D Productivity Statement empowered to adjust the mature target within the paper’s own £11-23 billion sensitivity range if updated OBR productivity data warrants it. Funding should be concentrated on AI, autonomy, cyber, quantum, sensing, secure communications, space, undersea systems, advanced materials, energy resilience and manufacturing processes. This path updates the Coghlan R&D bonds letter’s £5 billion to £20 billion proposal by embedding it in the modelled range of roughly £11 billion to £23 billion a year needed to close the productivity gap, with the central £17 billion (or IP-expensing-adjusted £16 billion) figure as the working base case and the fuller range retained as sensitivity bounds (Coghlan, R-Dbondsletter.pdf; Campbell et al., w35472.pdf; Antolin-Diaz and Surico, ADS-LREGS-Mar24.pdf; OBR Briefing Paper No.9). Mission grants and dual-use contracts should follow a British Bayh-Dole default — letting performing firms, universities and start-ups own resulting IP, with the Government retaining only a non-exclusive licence — because publicly funded but privately owned patents deliver a present-value output multiplier of 8.67 against 4.01 for private R&D and three times the private-R&D crowd-in, whereas historically DoD- and NASA-retained patents delivered smaller, often statistically insignificant effects (Gazzani, Martinez, Natoli and Surico, Where Do Technology Shocks Come From? Public Funding and Private Ownership, 2026).
Ring-fence borrowing through gilt-market-safe UK Innovation Bonds. The Treasury should pilot a dedicated R&D/Innovation Bond within normal DMO gilt issuance, with proceeds legally restricted to R&D, defence innovation infrastructure, prototype procurement and scale-up co-investment. The ten-year ramp should be OBR-certified before announcement, structured so the mature Scenario 1 requirement of about £17 billion a year (about £16 billion a year under Scenario 2 once Recommendation 6 is credited) is reached gradually rather than as a one-off shock, and reported as investment or financial transactions wherever national-accounts treatment permits. The proceeds should be divided into three streams identified in Surico’s defence innovation-bond papers: a defence innovation stream, including a dedicated ARIA defence directorate; a scale-up finance stream, including NSSIF/British Business Bank equity injections; and a critical production-capacity stream that builds competition rather than entrenching incumbents (Surico, NIn-Defence-of-Defence-Bonds.pdf; Surico, NBorrowingForDefence_HMT.pdf; DMO Financing Remit Announcement 2026-27).
Launch an Allied Joint Defence R&D Bond Facility. The UK should convene willing NATO, AUKUS and European partners to issue joint or jointly guaranteed bonds for common defence R&D and procurement-linked innovation. The facility should draw from SURE’s guarantee model, NGEU’s large-scale programme issuance and SAFE’s defence loan architecture while adapting them to a non-EU allied format, and can point to Mario Draghi’s explicit September 2025 call for “common debt for common projects” in defence R&D as evidence that this thinking already commands support at the highest levels of European policymaking (European Commission SURE; European Commission NextGenerationEU; European Commission SAFE; Draghi, One Year After the Draghi Report, 16 September 2025).
Build a defence-tech scale-up platform inside the British Business Bank architecture. The Government should consolidate British Patient Capital, NSSIF, Future Fund: Breakthrough, DASA and Project FORGE into a rules-based co-investment platform that invests alongside private capital in strategic deep-tech and defence-tech companies. The platform should use private selection with public risk-sharing, require UK value capture, and publish portfolio-level performance. Equity injections into BBB/NSSIF should be treated transparently as financial transactions, with published asset valuations and performance reporting, because the economic case depends on retaining intellectual property, production capacity and future tax bases in the UK (Surico, NBorrowingForDefence_HMT.pdf).
Unlock patient pension capital for diversified scale-up funds. Defined contribution pension schemes should be given standardised, fiduciary-compatible vehicles to invest in diversified venture-growth and defence-tech scale-up funds, with public cornerstone capital or partial guarantees where necessary. The purpose is not to direct pension trustees politically, but to create investable, liquid-enough, risk-managed products that fit their duties.
Abolish the Patent Box and fund full expensing of IP investment with the saving, crediting its productivity effect against the Innovation Bond programme’s mature target. The Government should preserve generous R&D tax relief for genuinely additional R&D and simplify claims for high-integrity SMEs, but abolish the Patent Box outright rather than merely reform it: Gaessler, Hall and Harhoff’s peer-reviewed evidence finds it delivers no positive effect on genuine invention, functioning mainly as an income-shifting device (Gaessler, Hall and Harhoff, GaesslerHallHarhoff20_patent_box_RP.pdf). Its roughly £1.3-2.0 billion annual cost should fund full, immediate expensing of intellectual property investment at an estimated cost of about £900 million a year — delivering an estimated 0.24-0.32% GDP gain over four to five years, roughly twice the near-term payoff per pound of an equivalent addition to public R&D. Because this productivity gain is complementary to, not a substitute for, the R&D-bond programme’s own slower-building uplift (Section 4d), it should be credited against the programme’s mature target, reducing the Innovation Bond programme’s mature borrowing requirement from £17 billion to about £16 billion a year (£16.05bn, a reduction of roughly £0.95bn a year, or 5.6%) — with the residual net fiscal saving of £0.4-1.1 billion a year available to support the reduced programme’s early pilot years (Martinez and Surico, Full_IP_Expensing_Memo.pdf; Coghlan, ExchequerSecretaryLetter11thMarch.pdf; HMRC R&D tax relief guidance; HMRC Patent Box statistics). Because this reform is close to self-financing, it should be legislated alongside, not instead of, the Innovation Bond programme.
Make procurement the bridge from R&D to productivity. The MOD should convert 10% of the equipment budget for novel technologies into transparent challenge-based procurement pathways, with faster contracting, milestone payments, modular open systems, SME participation and exportability. The Defence Industrial Strategy’s 10% equipment-budget commitment will only raise productivity if it becomes a predictable market signal rather than a series of disconnected pilots (Defence Industrial Strategy 2025).
Publish an annual Defence R&D Productivity Statement. The statement should report public R&D outlays, private R&D crowd-in, patents, spin-outs, procurement conversion, allied co-financing, export orders, regional investment and estimated productivity effects against the model in Section 2b. It should also certify whether the next year’s Innovation Bond tranche should proceed, pause or be resized, based on OBR fiscal-rule headroom, NAO additionality evidence and market conditions. It should be jointly owned by HM Treasury, DSIT, MOD and DBT, and scrutinised by Parliament.
Report the defence R&D mission’s contribution to NATO’s 2035 commitments in every Defence R&D Productivity Statement. Because the mission is simultaneously a productivity investment and defence and dual-use expenditure, each annual statement should quantify how much of the remaining gap to NATO’s 3.5% core and 5.0% total Hague targets the mission has closed to date, so that Parliament and allies can track the mission’s contribution to burden-sharing alongside its productivity effects. On this paper’s Scenario 1 modelling, the mission alone would take UK defence-related spending to about 3.56% of GDP by 2035-36, closing about 28% of the remaining gap to the full 5.0% commitment without any additional headline defence budget (NATO; Strategic Defence Review 2025).
7. Conclusion
Britain’s productivity crisis and the deterioration of the security environment are often presented as a dilemma: either fund growth or fund defence; either protect public services or meet NATO commitments; either keep debt down or invest. That framing is wrong. The UK should not borrow for routine consumption and call it strategy. But it should borrow, jointly where possible, for disciplined R&D and defence-tech investment that raises the economy’s future productive capacity.
The evidence points to a practical synthesis. Public R&D has long-lived productivity effects. Defence R&D has a proven history of civilian spillovers. The UK has scientific strength but a scale-up finance gap. Allies need common capabilities and already have precedents for pooled borrowing. Chris Coghlan’s parliamentary interventions and Paolo Surico’s research converge on one proposition: the safest way to finance a stronger state is to make the economy more productive, and one of the most credible ways to make the economy more productive is to invest in defence and dual-use R&D.
The modelling in this paper shows that this need not be a permanent addition to the national debt. Building the OBR’s own AI productivity upside into the working baseline from the outset — not a heroic assumption about AI, but the OBR’s own published scenario — roughly halves the funding required, to Scenario 1’s base case of about £17 billion a year. Scenario 2 then credits the further productivity contribution of making patent purchases tax-deductible — a reform that delivers an early, front-loaded productivity kick precisely while the R&D-bond programme’s own slower-building uplift is still ramping up — reducing the borrowing requirement further still, to about £16 billion a year, with the two reforms together tracing a path back to Britain’s historic 2% productivity norm by 2035-36. On the primary funding path, debt-to-GDP rises only modestly for a few years before the productivity dividend turns the programme debt-reducing, ending the decade several percentage points of GDP below the OBR’s no-action baseline. Mario Draghi has reached the identical conclusion for Europe, calling for “common debt for common projects” on the grounds that a modest productivity gain can cut the public finance burden by a third. Britain does not need to choose between fiscal discipline and a defence R&D mission; done well, one delivers the other.
A successful policy will be judged not by announcements, but by whether British workers have better tools, British firms scale at home, British allies share the cost of common security, and British productivity finally breaks from its post-2008 stagnation. Defence R&D is not a substitute for planning reform, skills, infrastructure or competition. It is the missing mission that can connect them.
References / Bibliography
· Antolin-Diaz, Juan, and Paolo Surico. The Long-Run Effects of Government Spending. ADS-LREGS-Mar24.pdf.
· Campbell, Sheila, Jaeger Nelson, Eli A. Schrag, Heidi L. Williams and Caleb K. Wroblewski. Estimating the Economic Effects of Federally Funded R&D. NBER Working Paper 35472. w35472.pdf; public working paper page: http://www.nber.org/papers/w35472.
· Coghlan, Chris. Issuing up to £20 billion a year of research and development bonds to accelerate economic growth. R-Dbondsletter.pdf.
· Surico, Paolo. Borrowing for Defence: When Borrowing for Defence Makes Sense, and when it Doesn’t. Surico_BorrowingForDefence_oped080626.docx.
· Surico, Paolo. Borrowing for Defence: Composition, Growth and the Fiscal Framework. NBorrowingForDefence_HMT.pdf.
· Surico, Paolo. In Defence of Defence Bonds. Surico_Defence_bonds.docx.
· Surico, Paolo. In Defence of Defence Innovation Bonds. NIn-Defence-of-Defence-Bonds.pdf.
· Surico, Paolo. Building a UK Scale-Up Finance Architecture: Patient capital, British Business Bank co-investment, and revenue-neutral innovation reform. UK_ScaleUP_Finance_Surico.pdf.
· Draghi, Mario. High Level Conference – One Year After the Draghi Report: What Has Been Achieved, What Has Changed. Speech, Brussels, 16 September 2025. Draghi_Speech_High_Level_Conference_One_Year_After.pdf; official text: https://commission.europa.eu/document/download/0951a4ff-cd1a-4ea3-bc1d-f603decc1ed9_en.
· Cloyne, James, Joseba Martinez, Haroon Mumtaz, and Paolo Surico. Corporate Taxes, Innovation and Productivity. Working paper, 2025. CMMS.pdf; hosted version: https://www.josebamartinez.com/pdf/CMMS.pdf.
· Martinez, Joseba, and Paolo Surico. Memorandum on Full Expensing of Intellectual Property Investment. Full_IP_Expensing_Memo.pdf.
· Gaessler, Fabian, Bronwyn H. Hall, and Dietmar Harhoff. Should There Be Lower Taxes on Patent Income? Research Policy 50(1), 2021 (originally NBER Working Paper 24843, 2018). GaesslerHallHarhoff20_patent_box_RP.pdf; DOI: https://doi.org/10.1016/j.respol.2020.104129.
· Coghlan, Chris. Letter to the Exchequer Secretary to the Treasury, James Murray MP, 11 March 2025. ExchequerSecretaryLetter11thMarch.pdf.
· Gazzani, Andrea, Joseba Martinez, Filippo Natoli and Paolo Surico. Where Do Technology Shocks Come From? Public Funding and Private Ownership. July 2026. https://josebamartinez.me/pdf/GMNS_TechShocks.pdf.
· Bank of England. “Asset Purchase Facility: Gilt Sales – Market Notice 20 March 2026.” https://www.bankofengland.co.uk/markets/market-notices/2026/march/apf-gilt-sales-market-notice-20-march-2026.
· Bank of England. “Bank of England announces gilt market operation.” https://www.bankofengland.co.uk/news/2022/september/bank-of-england-announces-gilt-market-operation.
· BBC. “The inside story of the mini-budget disaster.” https://www.bbc.com/news/business-66897881.
· Bloomberg. “United Kingdom Rates & Bonds.” https://www.bloomberg.com/markets/rates-bonds/government-bonds/uk.
· Central Bank Watch. “UK Gilt Yield Curve 2026.” https://centralbank.watch/tools/yield-curve/uk-yield-curve/.
· Congressional Budget Office. “Estimating the Economic Effects of Federally Funded R&D: Working Paper 2026-08.” https://www.cbo.gov/publication/62387.
· HM Treasury. “A strong fiscal framework.” https://assets.publishing.service.gov.uk/media/67211bf34da1c0d41942a8bf/A_strong_fiscal_framework.pdf.
· HM Treasury. “Review of discounting in the Green Book: Terms of reference.” https://www.gov.uk/government/publications/green-book-discount-rate-review-2026/review-of-discounting-in-the-green-book-terms-of-reference.
· Office for National Statistics. “Gross Domestic Product at market prices: Current price: Seasonally adjusted £m, YBHA.” https://www.ons.gov.uk/economy/grossdomesticproductgdp/timeseries/ybha/pn2.
· UK Debt Management Office. “DMO Financing Remit Announcement for 2026-27.” https://www.dmo.gov.uk/media/gnffn5rz/sa030326.pdf.
· UK Government. “Debt Management Report 2026-27.” https://www.gov.uk/government/publications/debt-management-report-2026-27/debt-management-report-2026-27.
· World Bank. “Research and development expenditure (% of GDP), GB.XPD.RSDV.GD.ZS.” https://api.worldbank.org/v2/country/KOR;ISR;USA;DEU;GBR/indicator/GB.XPD.RSDV.GD.ZS?format=json&per_page=500.
· Bruegel. “Do financial markets consider European common debt a safe asset?” https://www.bruegel.org/blog-post/do-financial-markets-consider-european-common-debt-safe-asset.
· European Commission. “NextGenerationEU.” https://commission.europa.eu/strategy-and-policy/eu-budget/eu-borrower-investor-relations/nextgenerationeu_en.
· European Commission. “SAFE | Security Action for Europe.” https://defence-industry-space.ec.europa.eu/eu-defence-industry/safe-security-action-europe_en.
· European Commission. “SURE.” https://economy-finance.ec.europa.eu/eu-financial-assistance/sure_en.
· European Parliament. “Security Action for Europe (SAFE).” https://www.europarl.europa.eu/legislative-train/carriage/security-action-for-europe-(safe)/report?sid=9801.
· HMRC. “Research and Development tax relief: the merged scheme and enhanced R&D intensive support.” https://www.gov.uk/guidance/research-and-development-rd-tax-relief-the-merged-scheme-and-enhanced-rd-intensive-support.
· HMRC. “Patent Box Relief Statistics: September 2025.” https://www.gov.uk/government/statistics/patent-box-reliefs-statistics/patent-box-relief-statistics-september-2025.
· House of Commons Library. “Productivity: Key Economic Indicators.” https://commonslibrary.parliament.uk/research-briefings/sn02791/.
· House of Commons Library. “UK defence spending.” https://commonslibrary.parliament.uk/research-briefings/cbp-8175/.
· Ministry of Defence. Defence Industrial Strategy 2025: Making Defence an Engine for Growth. https://assets.publishing.service.gov.uk/media/68bea3fc223d92d088f01d69/Defence_Industrial_Strategy_2025_-_Making_Defence_an_Engine_for_Growth.pdf.
· NATO. “Defence expenditures and NATO’s 5% commitment.” https://www.nato.int/en/what-we-do/introduction-to-nato/defence-expenditures-and-natos-5-commitment.
· Office for Budget Responsibility. Forecasting productivity. https://obr.uk/docs/dlm_uploads/Briefing_paper_No.9_Forecasting_productivity.pdf.
· Office for Budget Responsibility. Economic and Fiscal Outlook – November 2025. https://obr.uk/docs/dlm_uploads/OBR_Economic_and_fiscal_outlook_November_2025.pdf.
· Office for National Statistics. “UK gross domestic expenditure on research and development: 2023.” https://www.ons.gov.uk/economy/governmentpublicsectorandtaxes/researchanddevelopmentexpenditure/bulletins/ukgrossdomesticexpenditureonresearchanddevelopment/2023.
· Office for National Statistics. “UK productivity flash estimate: January to March 2026 and October to December 2025.” https://www.ons.gov.uk/employmentandlabourmarket/peopleinwork/labourproductivity/articles/ukproductivityintroduction/januarytomarch2026andoctobertodecember2025.
· Royal Academy of Engineering Enterprise Hub. “State of UK Deep Tech 2025.” https://enterprisehub.raeng.org.uk/news-resources/reports/deep-tech-report-2025/.
· UK Government. “The Defence Investment Plan Funding explainer.” https://www.gov.uk/government/publications/the-defence-investment-plan/the-defence-investment-plan-funding-explainer.
· UK Government. “The Strategic Defence Review 2025: Making Britain Safer.” https://www.gov.uk/government/publications/the-strategic-defence-review-2025-making-britain-safer-secure-at-home-strong-abroad/the-strategic-defence-review-2025-making-britain-safer-secure-at-home-strong-abroad.
· UK Parliament. “Chris Coghlan — Finance Bill.” https://hansard.parliament.uk/commons/2024-11-27/debates/E29FAD0D-3B9C-46EC-9D7C-EB080E75553F/FinanceBill.
· UK Parliament. “Chris Coghlan — Spring Statement.” https://hansard.parliament.uk/commons/2025-03-26/debates/CD77EAF2-8DB9-4F16-93CA-3E244CA9079E/SpringStatement.
· UK Parliament. “Chris Coghlan — Spending Review 2025.” https://hansard.parliament.uk/commons/2025-06-11/debates/AA2E816F-02F9-4C3A-920A-BAFEDF4B422E/SpendingReview2025.
· UK Parliament. “R&D public leverage written answer.” https://questions-statements.parliament.uk/written-questions/detail/2025-02-06/29744/.
· UK Parliament Treasury Committee. “Oral evidence: Spending Review 2025, HC 1023.” https://committees.parliament.uk/oralevidence/16089/pdf/.
· UK Parliament Treasury Committee. “Publication types: correspondence including defence spending and finance.” https://api.parliament.uk/committees/committees/158/publication-types/3.
· London Business School. “Innovators could get tax breaks to boost UK productivity.” 13 October 2025. https://www.london.edu/news/innovators-could-get-tax-breaks-to-boost-uk-productivity.